METHODOLOGY

कार्यप्रणाली

Our methodology is built on a data-driven, transparent, and unbiased framework that ranks political parties based on their actual performance while in power in any given Indian state. This process ensures that the focus remains on development outcomes, not ideological leanings or media narratives. Below is a simplified yet comprehensive explanation of how we evaluate governance—so every citizen can understand how we reach our conclusions.

We examine how a political party has governed a state during its term. For example, we assess AAP’s work in Delhi from 2015 to 2020 independently of their performance in other places or times. This means we don’t generalize – each state is judged on its own, ensuring local governance is rightly credited or questioned. So, a party can score well in one state and poorly in another, depending on its actual work.

We only review complete or near-complete government terms. A minimum of 3 years in power is required for a party to be assessed, as this gives enough time to bring visible change. For instance, if a party ruled from 2017 to 2022 in Uttar Pradesh, we use that full term’s data for evaluation. This avoids judging too early or too late.

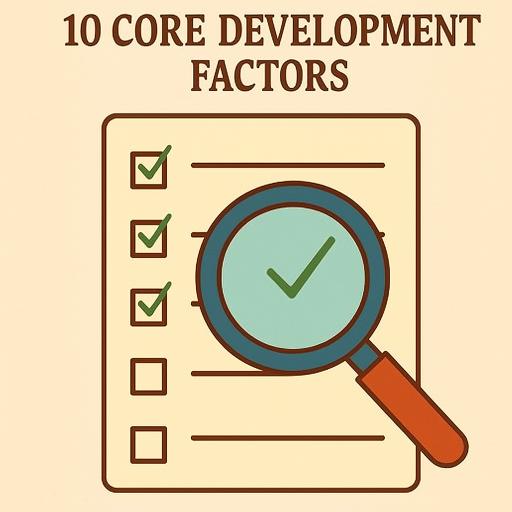
We rank parties based on 10 essential areas that matter most to people’s lives, like health, jobs, education, and safety. These are common to every Indian, no matter which state or village they live in. Each category is broken into smaller points so we can measure real progress. For example, ‘Healthcare Access’ is checked through things like hospital availability and infant mortality.

Each big factor has 6–8 sub-factors. But not all sub-factors carry equal weight. For instance, while number of hospital beds matters, we give more weight to maternal deaths and child health because they directly show life-saving outcomes. This helps us avoid giving high scores for just spending money without impact. Each point is weighted based on importance to people’s quality of life.

We only use government and official data that is available to the public—no media articles, no private surveys. For example, crime data comes from the National Crime Records Bureau, education data from UDISE, health outcomes from NFHS, and jobs from PLFS. This ensures no party can accuse us of bias or manipulation. We also cross-check data from multiple sources to avoid errors.

We convert each sub-factor into a score between 0 and 10. A state that performs well in reducing unemployment or improving education gets closer to 10. A state that shows poor performance or no change gets a lower score. For instance, if a state increased electricity coverage from 60% to 98%, it scores high under infrastructure growth.

Scroll to Top